Configuring PostgreSQL and the operating system for a heavy read workload involves optimizing various settings to improve performance, reduce latency, and ensure efficient resource utilization. Below are recommended configurations and best practices:
PostgreSQL Configuration
- Memory Settings:
- shared_buffers: Allocate 25-40% of your system’s RAM. This is PostgreSQL’s primary memory cache for data. For example:
shared_buffers = 8GB
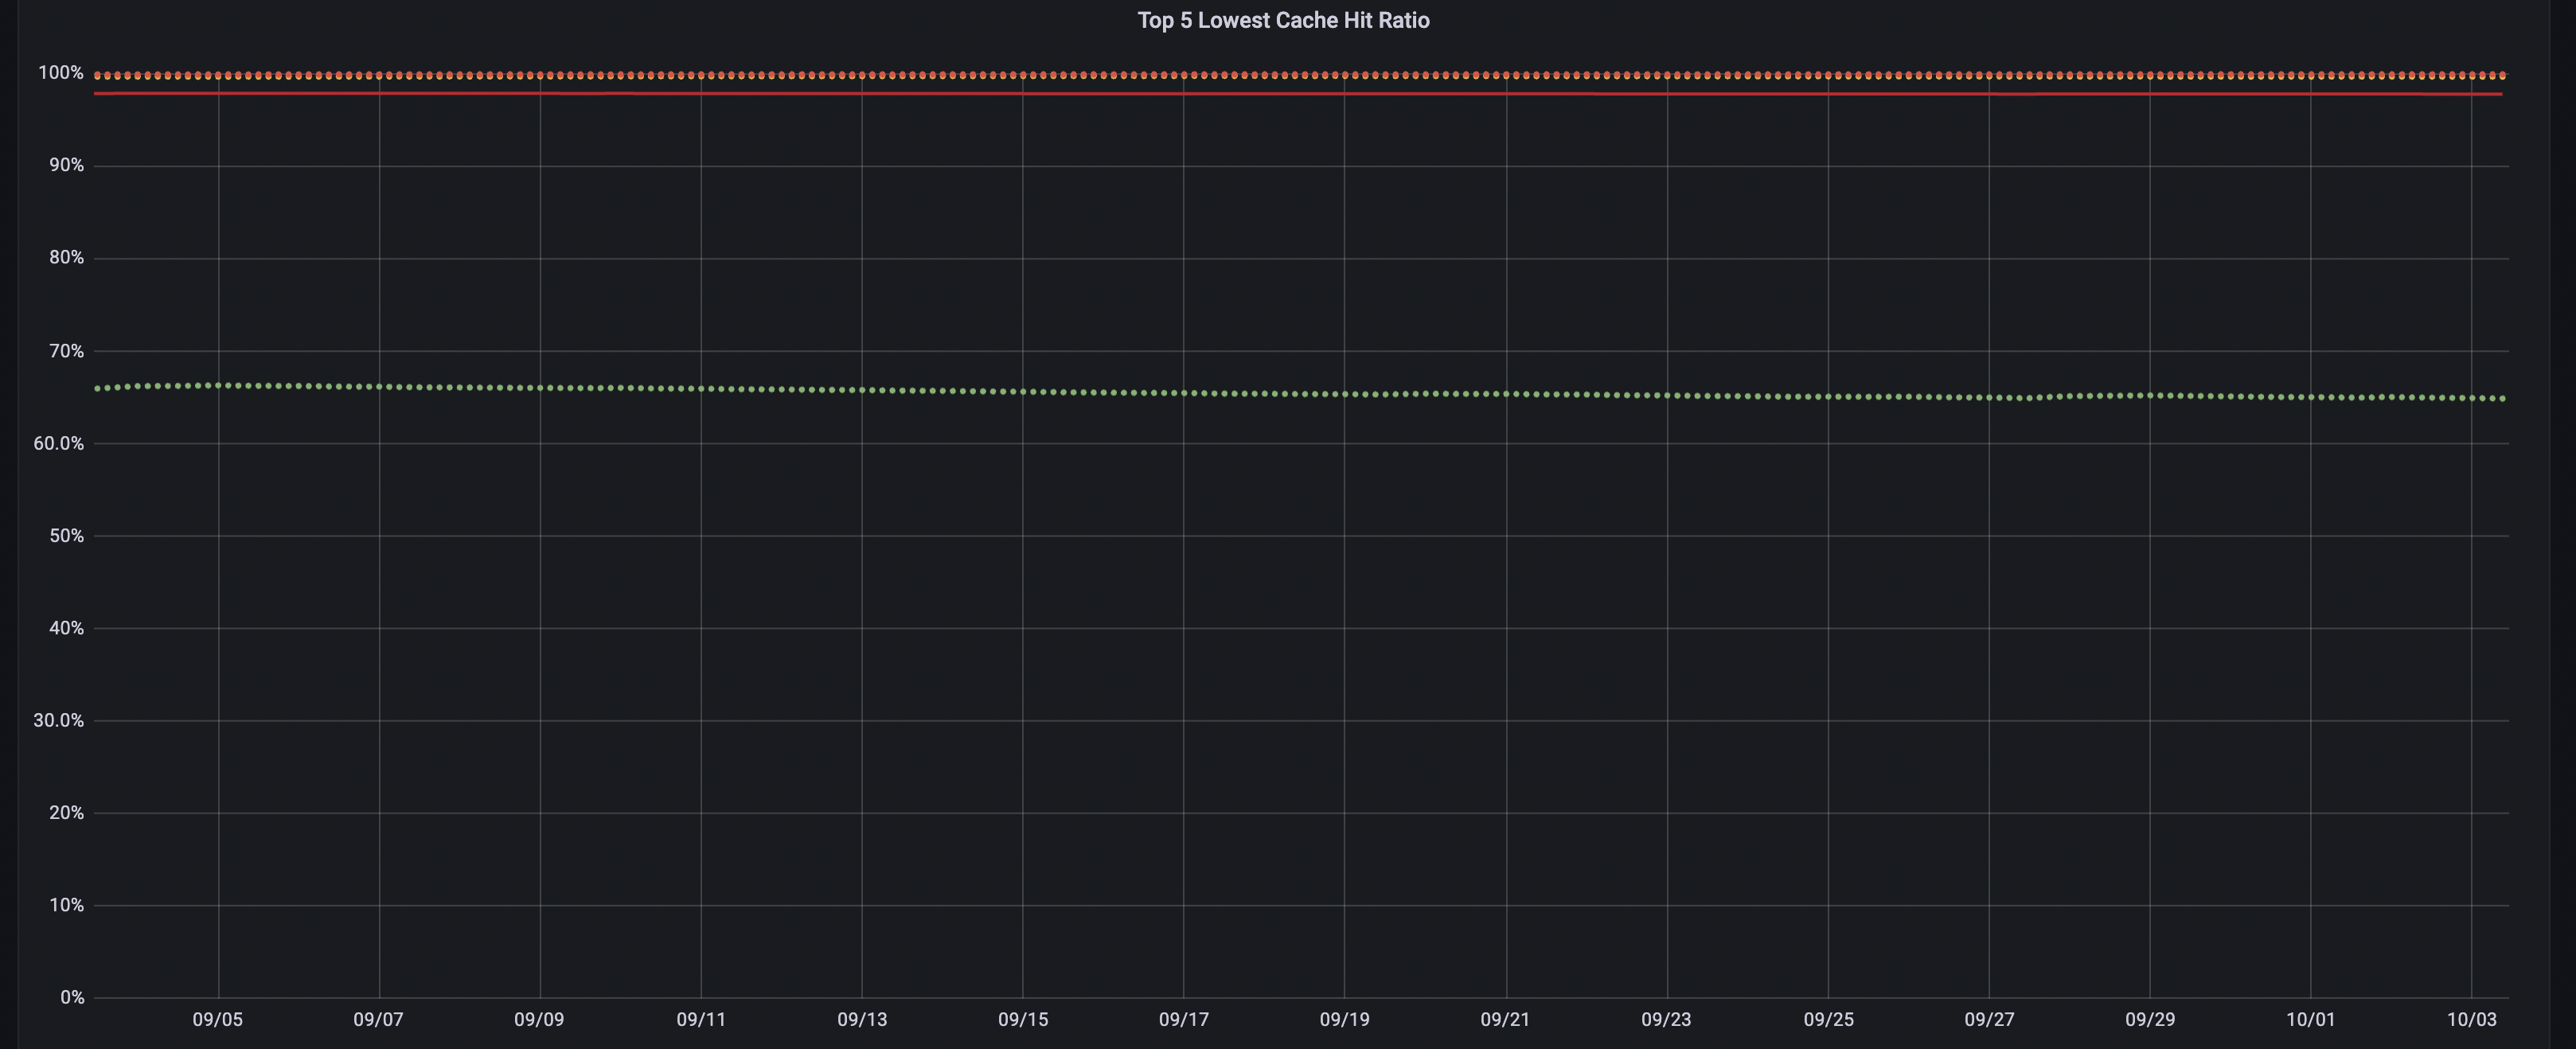
Purpose: It acts as a cache for database pages. When a query requests data, PostgreSQL first checks this cache. If the required data is present (a cache hit), it can be returned quickly without disk access. - work_mem: Set this to a higher value, especially for complex queries that involve sorting and hashing. Start with 16-64MB and adjust based on query performance:
work_mem = 32MBPurpose: It is primarily used for operations that require sorting (like
ORDER BY,DISTINCT, andGROUP BY) and for hash tables used in join operations. Allocating enough memory can reduce the need for disk I/O during these operations, which can significantly enhance performance. - effective_cache_size: Set this to about 75% of your system’s RAM. This helps the query planner make better decisions about using cached data:
effective_cache_size = 12GBPurpose: It represents the total amount of memory that is expected to be available for caching database pages, including memory allocated by the OS file system cache and PostgreSQL shared buffers.
- shared_buffers: Allocate 25-40% of your system’s RAM. This is PostgreSQL’s primary memory cache for data. For example:
- Autovacuum Settings:
- autovacuum_vacuum_cost_limit: Increase this value to ensure that autovacuum does not interfere with read operations. Set it to a higher limit based on your system’s capacity:
autovacuum_vacuum_cost_limit = 2000Purpose: Theautovacuum_vacuum_cost_limitparameter sets the maximum cost that the autovacuum worker can consume while processing a table. The cost is measured in terms of I/O operations, which helps prevent autovacuum from overwhelming the system during peak usage times. - autovacuum_naptime: Keep it at the default (60 seconds) unless you have specific needs to adjust it.
Purpose:autovacuum_naptimespecifies the amount of time that the autovacuum worker will wait between successive checks for tables that need vacuuming or analyzing. It helps manage the frequency of autovacuum processes and ensures that they do not interfere excessively with normal database operations.
- autovacuum_vacuum_cost_limit: Increase this value to ensure that autovacuum does not interfere with read operations. Set it to a higher limit based on your system’s capacity:
- Query Performance:
- default_statistics_target: Increase this for columns with non-uniform data distributions. A value between 200 and 500 can help improve query planning:
default_statistics_target = 200Purpose: This parameter sets the default level of detail for statistics gathered by theANALYZEcommand on each column of a table. Higher values result in more detailed statistics, which can improve query planning and performance for complex queries.
- default_statistics_target: Increase this for columns with non-uniform data distributions. A value between 200 and 500 can help improve query planning:
- WAL Settings:
- wal_level: Set to
minimalfor read-heavy workloads that don’t require replication or point-in-time recovery. Otherwise, usereplicaif replication is needed:wal_level = minimalPurpose: Thewal_levelsetting determines what information is logged and how much detail is available for replication and backup purposes. It affects the size of the WAL files and the performance characteristics of your database. - checkpoint_timeout: Increase this to reduce the frequency of checkpoints, which can impact read performance. Consider values between 15 and 30 minutes:
checkpoint_timeout = 15minPurpose:checkpoint_timeoutdetermines how long PostgreSQL can wait before forcing a checkpoint. Regular checkpoints are essential for maintaining data durability and consistency, especially after a crash or failure. - max_wal_size: Set this to a higher value (e.g., 2-4GB) to allow more WAL before triggering a checkpoint:
max_wal_size = 2GBPurpose:max_wal_sizesets a limit on the total amount of WAL data that can be retained on disk before a checkpoint is triggered. Once this limit is reached, PostgreSQL will automatically initiate a checkpoint to flush the WAL contents to disk and free up space.
- wal_level: Set to
- Connection Settings:
- max_connections: Set this based on your expected workload and resource availability. Use connection pooling (e.g., PgBouncer) to manage connections efficiently.
Purpose: It limits the number of simultaneous connections to the PostgreSQL server, helping to prevent resource exhaustion and maintain system performance.
- max_connections: Set this based on your expected workload and resource availability. Use connection pooling (e.g., PgBouncer) to manage connections efficiently.
OS Configuration
- File Descriptors:
- Increase the limit for open files in the OS. Set this in
/etc/security/limits.conf:postgres soft nofile 65536postgres hard nofile 65536
- Increase the limit for open files in the OS. Set this in
- Swap Space:
- Ensure that your system has enough swap space to handle potential memory pressure, though you ideally want to minimize reliance on swap.
- Disk I/O:
- Use SSDs for storage to improve read performance significantly. Ensure that the disk subsystem can handle the expected read load.
- System Caches:
- Adjust the operating system’s filesystem cache settings to ensure it is optimized for caching frequently accessed data.
- Kernel Parameters:
- Tune the kernel parameters (e.g.,
vm.swappiness,vm.dirty_background_ratio,vm.dirty_ratio) to optimize memory management:
vm.swappiness = 10
vm.dirty_background_ratio = 5
vm.dirty_ratio = 10
- Tune the kernel parameters (e.g.,
Additional Considerations
- Indexes: Ensure that you have appropriate indexes on tables that are frequently read. Analyze your queries to identify which columns require indexing.
- Query Optimization: Regularly analyze and optimize your queries. Use
EXPLAINto understand how queries are executed and adjust your schema or indexes accordingly. - Monitoring Tools: Utilize monitoring tools like
pg_stat_activity,pg_stat_statements, and external monitoring solutions (e.g., PMM) to track performance and identify bottlenecks.
Conclusion
Optimizing PostgreSQL and the operating system for a heavy read workload involves careful tuning of memory settings, autovacuum behavior, query performance configurations, and ensuring the OS is capable of supporting the expected load. Regular monitoring and adjustments based on real-world usage will help maintain optimal performance as workloads change.

